

Creating a Smart Chart
From any dashboard or record analytics tab, click Edit Smart Chart to open the editor.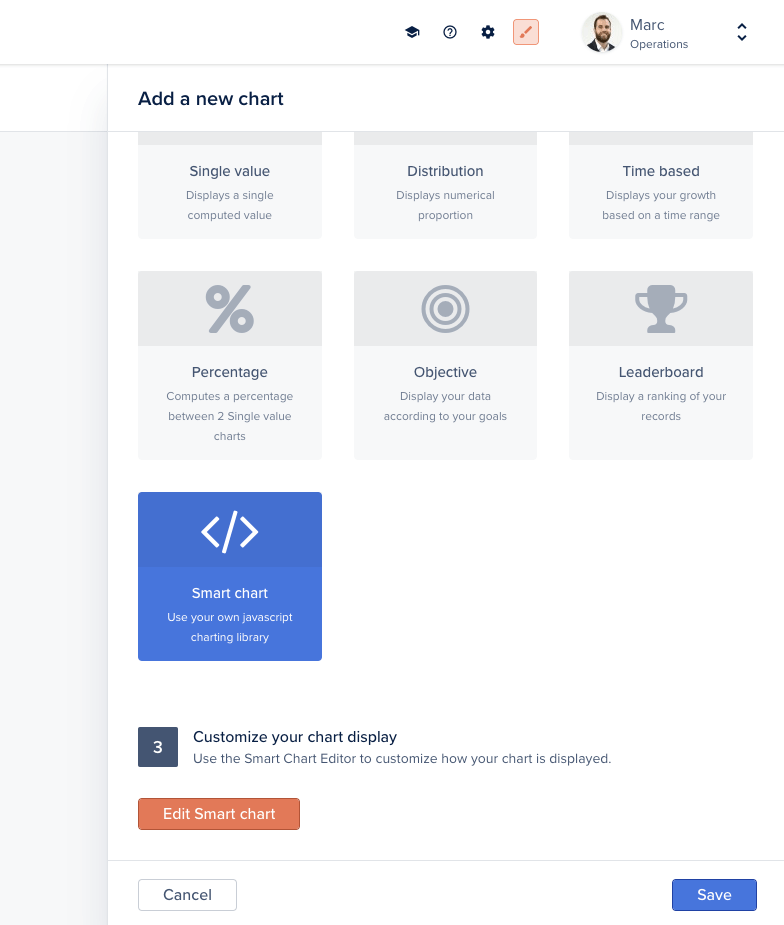
Open the Smart Chart editor
- Template, the Handlebars template that renders your chart
- Component, the JavaScript component that loads data and orchestrates rendering
- Style, optional CSS scoped to this chart
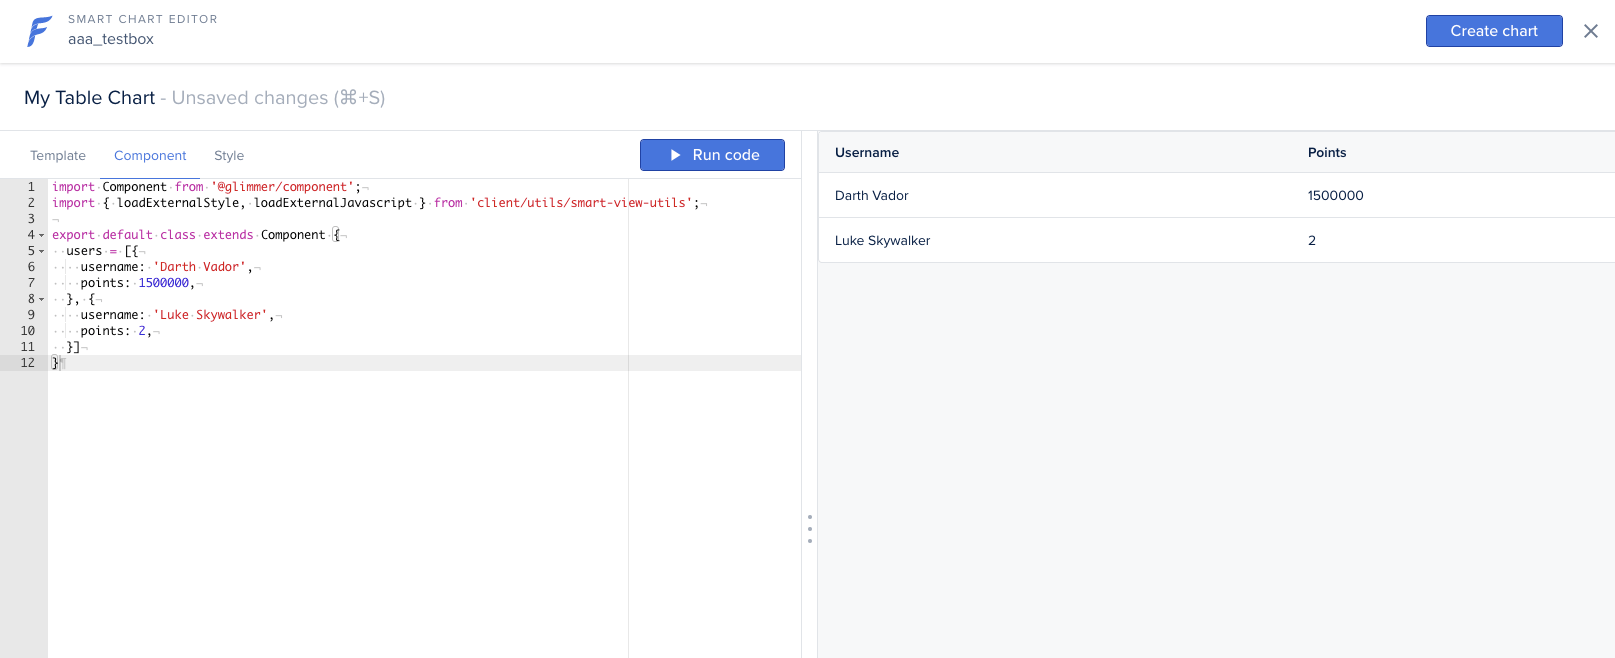
The Smart Chart code editor with Template, Component, and Style tabs
When creating a Smart Chart on a specific record (record’s Analytics tab), the
record object is directly accessible via this.args.record in the component or @record in the template.Defining the data source on the back-end
A Smart Chart pulls its data from a custom endpoint you expose on the back-end withaddChart. The handler returns any shape your component expects.
/forest/_charts/mytablechart and passes the data to the template.
Passing extra parameters
The chart handler’scontext exposes any custom query-string or body parameters sent to the chart endpoint via context.parameters, alongside context.caller (the current user). Use them to make a chart depend on a filter, a date range, or the current record:
context also exposes context.recordId, context.compositeRecordId, and context.getRecord(fields).
Example: table chart
A minimal table chart in three steps: back-end endpoint, component fetch, template.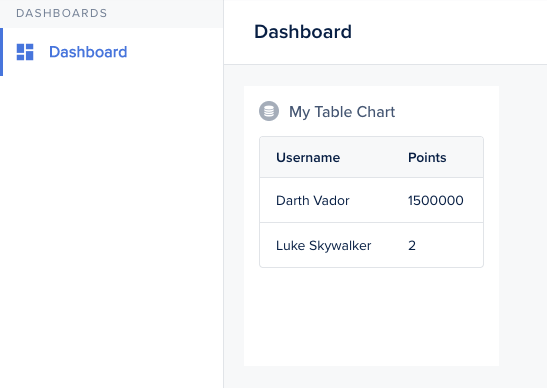
A custom table Smart Chart
Example: bar chart with D3.js
Smart Charts can load any external library. This bar chart uses D3.js, inspired by this example.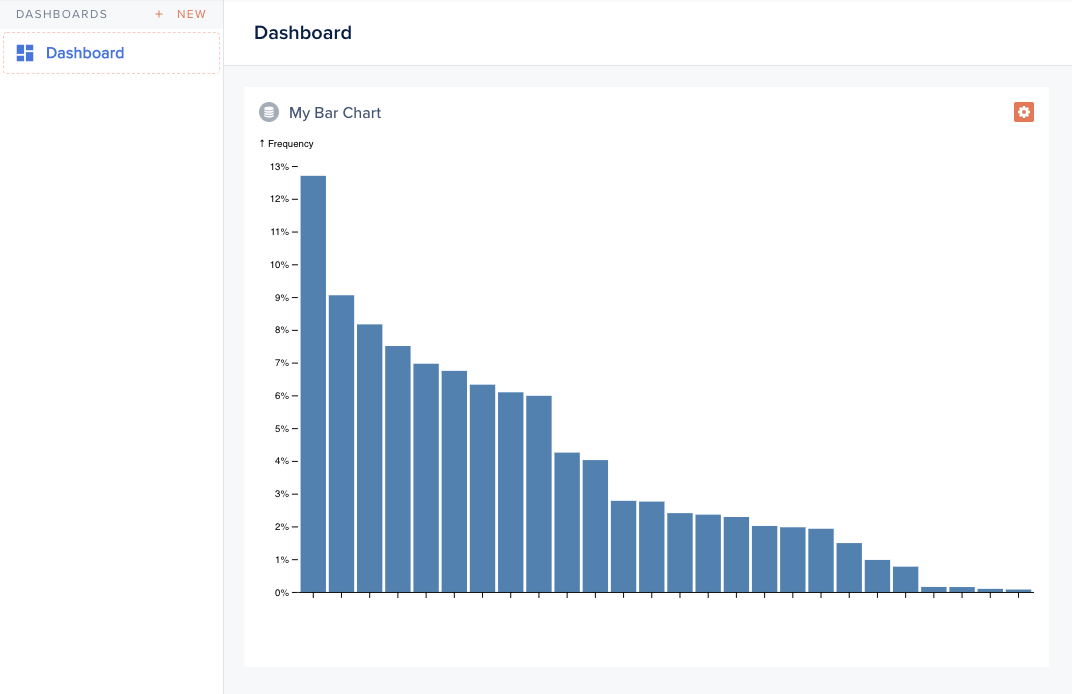
A custom bar chart rendered with D3.js
Example: cohort retention chart
A retention table with shaded cells, also using D3.js.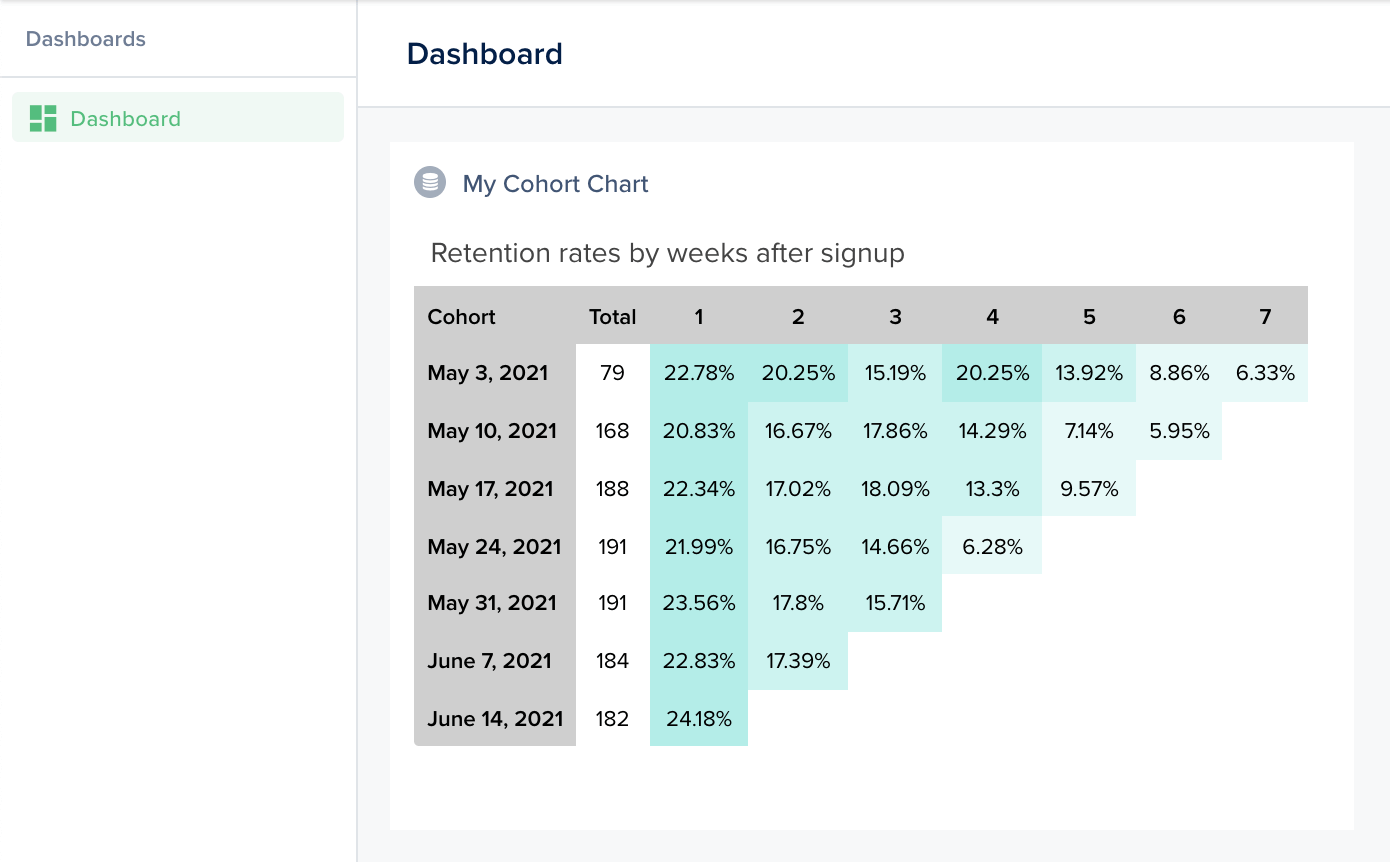
A cohort retention Smart Chart
Example: density map
A geographic density map, fetching contour data and population statistics, rendering with D3 + topojson.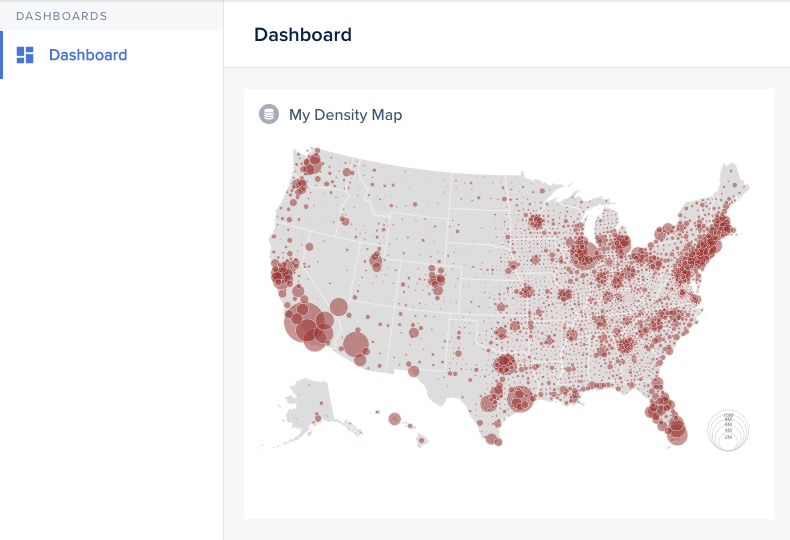
A density map Smart Chart